A Coruna city bike use
October the 10th was the Hackatiño Mobilidade Sostible. More than 60 people met in the Centro Agora of A Coruña city, Spain to work on city mobility. Hackers had several datasets from the city Major such a complete year registry of public bike, real time bus, real time traffic, parking lots, etc.
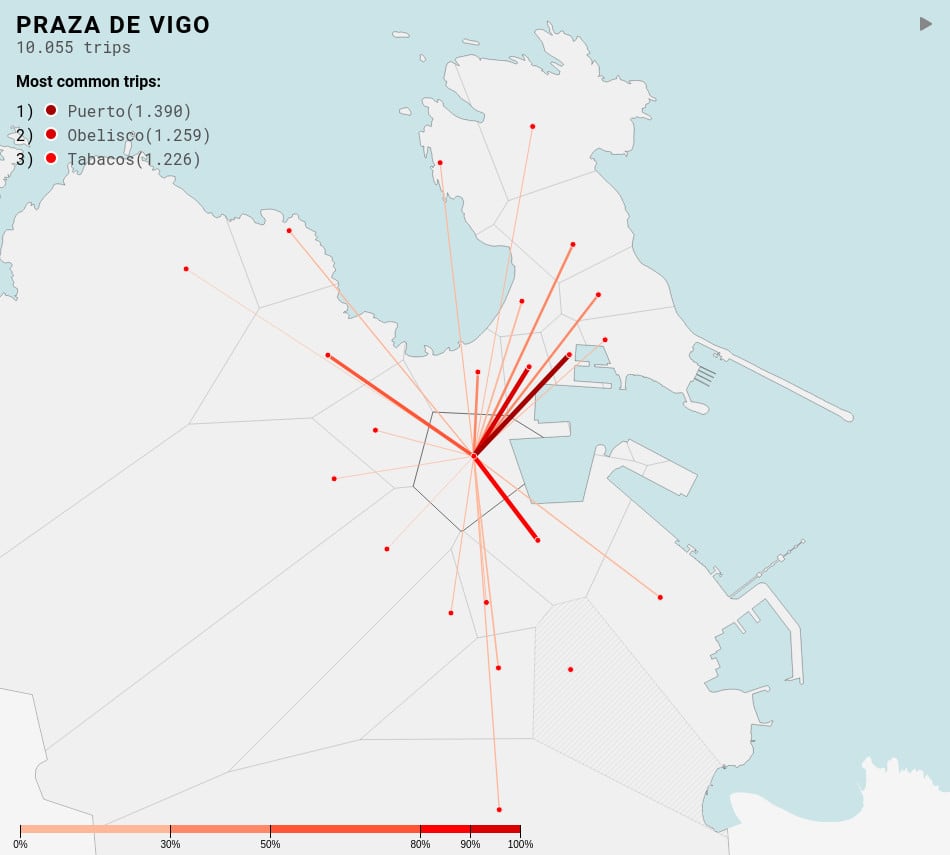
During the session the group that I was part of worked with data on the use of bicicoruña and came to produce four maps with Leaflet and D3js. Three heatmaps about general behaviour and use, trips with same departure and arrival station, time-lapse animated map. The last one was an attempt to show which one was the most common trip from each station (link).
The project was hosted on GitHub, feel free to make any suggestions, open issues or pull request. Link to the repository
 The map uses a shoreline to contextualize the map.
That day I couldn’t finish a map to show what was the most common trip from each station so moths after I return to the project and finish that map.
As the original datasets has a big size and to avoid complex processing on the client’s side, node is used to process the whole data and create a json object reducing the weight of the file in a 99,999280608% way.
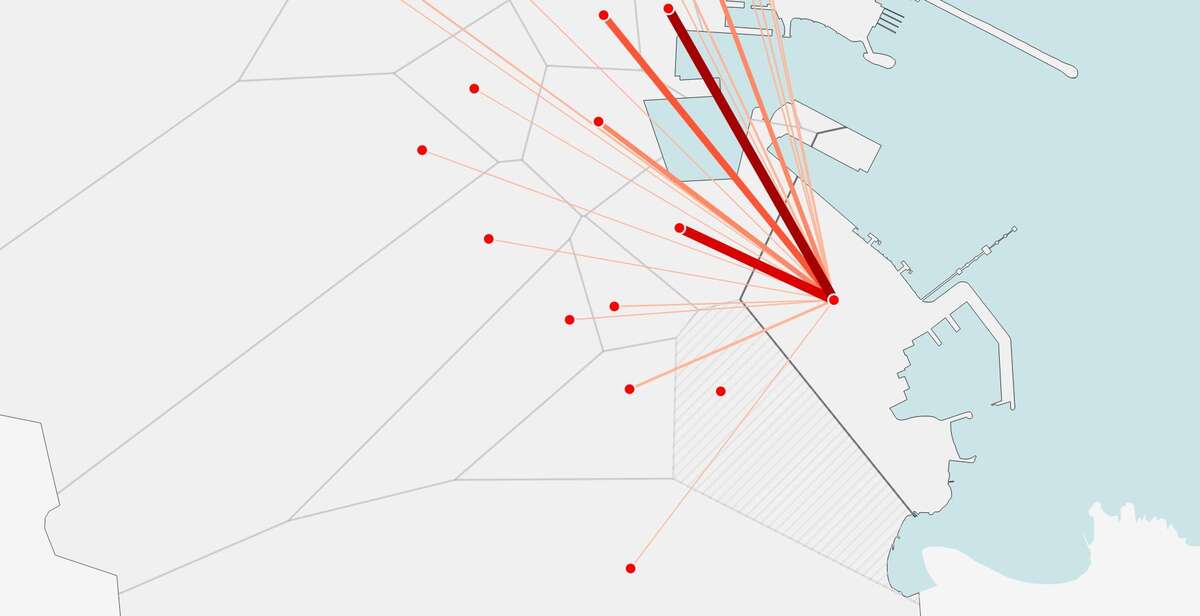 Detail of the map that shows the Santa Cristina beach of the Oleiros municipality.